


You just received a 40-page threat report. The CISO needs a briefing in two hours. And somewhere buried in that wall of text is the critical attack chain you need to communicate clearly.
Sound familiar?
Every Cyber Threat Intelligence (CTI) analyst knows this pressure. Reading, parsing, and manually mapping tactics, techniques, and procedures (TTPs) to the MITRE ATT&CK framework takes hours. But what if you could generate a visual attack flow in under a minute?
This is where FlowViz comes in.
This guide shows how FlowViz uses artificial intelligence to transform unstructured threat reports into interactive, MITRE ATT&CK-mapped visualizations. You will learn its core capabilities, see real-world use cases, and understand its limitations. By the end, you will know whether this open-source tool belongs in your CTI toolkit.
Let’s see how it works.
FlowViz
The Problem with Static Matrices
The MITRE ATT&CK Matrix has become the “Periodic Table” of adversary behavior. It categorizes the actions threat actors can take by organizing them into Tactics (the goal) and Techniques (the method). While it is invaluable for cataloging capabilities, the standard matrix view has a fundamental limitation.
It is non-temporal.
When you look at an ATT&CK layer (a “bingo card” of highlighted cells), you see what an adversary can do. But you do not see how they do it. The matrix flattens causality. It does not show that the adversary used Phishing (T1566) specifically to enable the execution of PowerShell (T1059.001), which then led to Credential Dumping (T1003). These appear as disjointed capabilities rather than a coherent narrative chain.
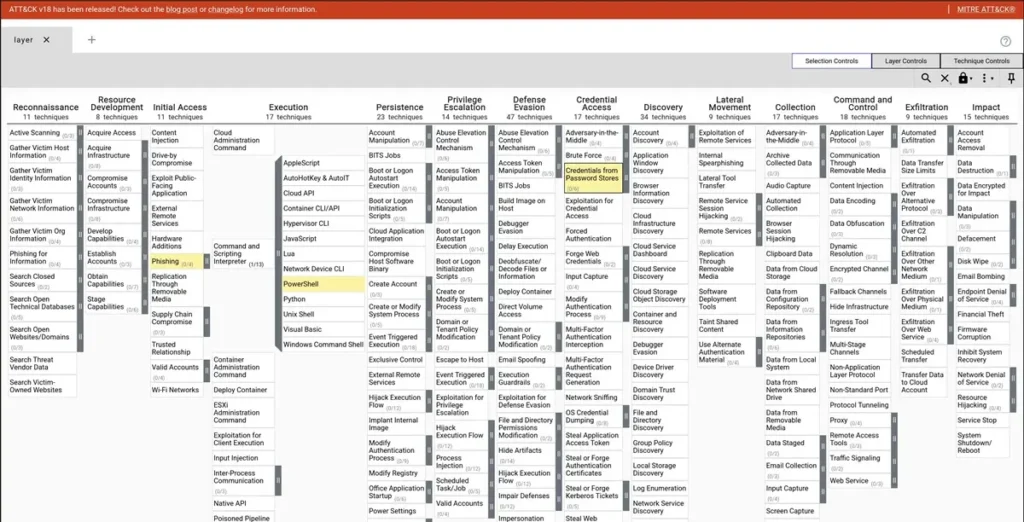
The operational reality of a cyberattack is a sequence of events. A flow. It involves loops, branches, failures, and retries.
Defenders need to identify “choke points” where disruption breaks the entire kill chain. The static matrix obscures these choke points. The attack flow reveals them.
The Solution: FlowViz
FlowViz is an open-source, web-based application designed to analyze cyber threat intelligence reports and generate interactive attack flow visualizations. Created by David Johnson, a Threat Intelligence Advisor at Feedly, it represents a significant shift in CTI tooling.
But FlowViz is not merely a drawing tool. It is an intelligence processor.
By leveraging Large Language Models (LLMs) such as Anthropic’s Claude and OpenAI’s GPT series, FlowViz automatically ingests unstructured threat reporting and transforms it into structured, temporal visualizations mapped to MITRE ATT&CK. It handles the “drudgery” of intelligence processing so you can focus on higher-order synthesis and strategic defense.
| Attribute | Details |
|---|---|
| Project Name | FlowViz |
| Repository | github.com/davidljohnson/flowviz |
| Creator | David Johnson (Threat Intelligence Advisor, Feedly) |
| License | MIT License (Open Source) |
| Core Technology | React (Frontend), Node.js (Backend), GenAI (LLMs) |
| Primary Output | Interactive Graph, STIX 2.1, Attack Flow Builder (.afb) |
| Hosting Model | Self-Hosted (Localhost) |
The tool’s philosophy centers on human augmentation. It does not seek to replace you.
Instead, it provides a “rough draft” of the attack flow in seconds, a task that would take hours to do manually. By handling the initial extraction of entities (actors, tools, malware) and relationships (temporal sequences), FlowViz allows you to enter the workflow at the verification stage rather than the creation stage.
FlowViz is free and open-source, but it operates on a “Bring Your Own Key” model. You need a valid API key from either OpenAI or Anthropic. Analyzing a typical 20-page report with GPT-4 or Claude 3 can cost between $0.10 and $2.00 per run, depending on the number of tokens used.
Core Capabilities
FlowViz transforms the way you process threat intelligence through four key capabilities. Each addresses a specific pain point in the standard CTI workflow.
Automated Article Analysis
The entry point for any FlowViz workflow is the analysis module. You can input a direct URL to a public threat report (from sources like The DFIR Report, Mandiant, Red Canary, or CISA) or paste raw text directly.
The raw text option is essential for analyzing private internal reports or draft blog posts before publication.
Once you provide the input, the AI does the heavy lifting.
It identifies not just keywords but semantic concepts. It distinguishes between a tool used defensively and one used offensively. It maps prose like “The attacker leveraged PowerShell to scrape memory” to specific ATT&CK IDs (T1059.001 and T1003).
Beyond techniques, FlowViz identifies threat actors and malware families. These are represented as distinct node types that align with STIX 2.1 object models.
Real-Time Interactive Visualization
The output is an interactive node-link diagram that grows as you watch.
FlowViz uses the streaming capabilities of LLM APIs to render nodes in real-time. As the model generates the JSON representation of the attack flow, the frontend parses the incoming stream and displays nodes on the canvas. You watch the attack flow “grow” as the AI “reads” the document. This provides immediate visual feedback rather than having to stare at a loading spinner.
Each node displays the Technique Name and ATT&CK ID. You can click on any node to reveal detailed information, including descriptions from the MITRE ATT&CK knowledge base or context from the source article.
The graph is fully interactive!
Story Mode: Cinematic Playback for Executives
The most distinctive feature of FlowViz is Story Mode.
Here is the problem: a complete attack flow graph can be overwhelming. It might contain 50 nodes with complex branching. Showing this entire chart to a CISO or non-technical stakeholder often leads to confusion rather than clarity.
Story Mode solves this by transforming the graph into a cinematic animation. It “plays” the attack like a movie.
The view zooms in on the Initial Access node, highlights it, then pans along the edge to the next step, then the next. You can narrate the attack in sync with the visual progression: “First, they entered here… then they moved laterally to the domain controller… finally, they exfiltrated the database.”
This feature bridges the gap between technical analysis and executive communication. It turns a static CTI report into a dynamic briefing tool.
STIX 2.1 and Attack Flow Builder Export
FlowViz does not just create pretty pictures. It produces machine-readable intelligence.
The tool exports in STIX 2.1, the lingua franca of modern CTI. This ensures that your output can be ingested by Threat Intelligence Platforms, such as OpenCTI or MISP, or correlated in SIEMs like Microsoft Sentinel.
Here is how FlowViz concepts map to STIX 2.1 objects:
| FlowViz Concept | STIX 2.1 Object | Description |
|---|---|---|
| Technique Node | attack-pattern | The TTP used (e.g., T1059) |
| Connection/Edge | relationship | Links two objects (sequence or related-to) |
| Threat Actor | intrusion-set | The adversary behind the activity |
| Malware | malware | The specific software used (e.g., Cobalt Strike) |
FlowViz also supports exporting to the .afb format, the native JSON format used by the MITRE Attack Flow Builder. This creates a powerful workflow: generate your rough draft in FlowViz, export the .afb file, then import it into the official MITRE tool for final polish and validation.
Think of FlowViz as a “force multiplier” for the Attack Flow Builder. Instead of building a flow from scratch (which takes hours), you generate a 90% complete flow in seconds.
FlowViz runs locally on your machine, so sensitive report text is not sent to a third-party FlowViz server. However, the data does flow to your chosen AI provider (OpenAI or Anthropic). If you are using OpenAI Enterprise or Anthropic via AWS Bedrock, you can ensure your data is not used to train public models.
Real-World Examples
These capabilities translate directly into operational value. Here are three scenarios that demonstrate FlowViz’s versatility in the daily rhythms of a Security Operations Center (SOC).
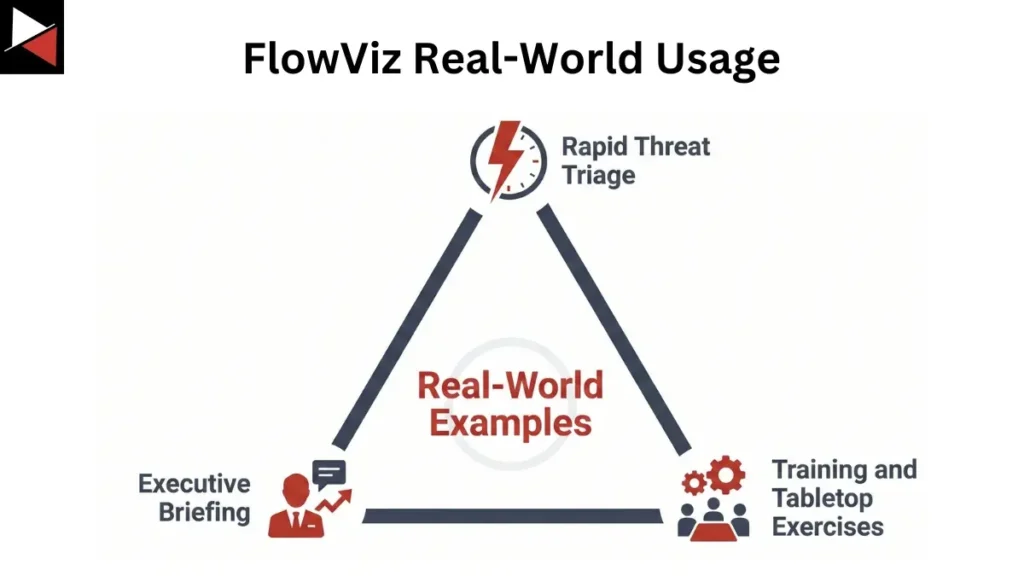
Scenario One: Rapid Threat Triage
A major ransomware group releases a new variant. A vendor publishes a 40-page report detailing the intrusion.
- Without FlowViz, you spend four hours reading the report, highlighting PDFs, and manually typing technique codes into a spreadsheet to assess whether your organization has coverage.
- With FlowViz, you feed the report URL into the tool. Within 60 seconds, a visual graph appears. You immediately see the critical path:
Now you can focus on the choke points. Do we detect QakBot? Do we block internal RDP? Time-to-coverage assessment drops from hours to minutes.
Scenario Two: Executive Briefing
The CISO needs to present to the Board of Directors about a high-profile breach that made the news.
You use FlowViz to map the breach from a public report. Then you switch to Story Mode.
During the briefing, you walk the board through the attack visually: “As you can see, the attack began here. We successfully block this step. However, if they bypassed that control, they moved here. This visualization confirms our investment in EDR blocked the later stages.”
Complex technical causality becomes a business-relevant narrative.
Scenario Three: Training and Tabletop Exercises
Your blue team needs a realistic scenario for a tabletop exercise.
You use FlowViz to generate a flow from a real-world incident report. This flow becomes the “inject” list for the exercise. The facilitator uses the sequence to drive the scenario: “Okay, the adversary has just completed Step 3, Process Injection. Blue Team, what do you see in your telemetry?”
Real-world data drives the exercise, ensuring it reflects actual adversary tradecraft rather than hypothetical scenarios. This aligns with building a mature threat-informed defense capability.
- Speed
Reduces the time to understanding from hours to minutes. Transform a typical 20 to 40-page report into a visual flow in under a minute. - Clarity
Reveals the temporal “how” of attacks, exposing choke points that static ATT&CK matrices obscure. - Communication
Story Mode bridges the gap between technical analysis and executive briefings, turning complex causality into a business-relevant narrative. - Democratization
A single analyst in a small SOC can now produce the same high-fidelity attack flow diagrams that used to require elite threat intelligence firms with large graphic design and analysis teams.
Known Limitations
Despite its transformative potential, FlowViz is constrained by the limitations of current generative AI technology. Understanding these will help you use the tool effectively.

The Hallucination Problem
LLMs are probabilistic engines, not deterministic databases. There is a risk that FlowViz will “hallucinate” a technique that is not present in the source text, or misinterpret a defensive recommendation as an offensive action.
This is why FlowViz is designed as a human-in-the-loop tool. It requires an analyst to verify the graph. It is a force multiplier, not a replacement for human judgment.
The Ambiguous Techniques Challenge
MITRE has identified a class of behaviors called “Ambiguous Techniques.” Actions such as “System Owner/User Discovery” (T1033) occur frequently during benign administrative activity. Distinguishing between an admin running whoami and an attacker doing the same relies heavily on context.
While LLMs handle context better than keyword searches, they can still struggle to differentiate malicious intent from benign background noise in a poorly written report.
Ambiguity in Linking
Determining exactly how two events are linked (the edge) is often harder than identifying the events themselves (the nodes). Reports often imply causality (“The system was compromised after the user clicked the link”) rather than explicitly stating it.
FlowViz must infer these edges. As David Johnson noted in a Feedly webinar on FlowViz, mapping accurate links between tactics and techniques remains one of the biggest challenges in this domain.
Export Limitations
FlowViz excels at exporting STIX and .afb files. However, it is not designed as a universal STIX viewer for importing arbitrary external bundles. It primarily functions as a source and generator of data, not as a destination or repository.
Summary
The era of manually parsing threat reports is coming to an end.
FlowViz represents the bleeding edge of AI-augmented threat intelligence. It addresses the critical problem of information overload with an elegant, open-source, and interoperable solution. By automatically transforming unstructured text into MITRE ATT&CK-mapped visualizations, it allows CTI analysts to move from reading about attacks to seeing them.
FlowViz does require supervision to manage AI accuracy. But the efficiency gains in visualizing complex intrusion sets are undeniable. It democratizes a capability that was once the domain of elite threat intelligence firms, putting high-fidelity attack flow diagrams within reach of any analyst.
The era of the static spreadsheet is ending. The era of the automated attack flow has begun.
Getting Started with FlowViz
Ready to try it yourself? Here is how to get started:
- Clone the repository: Visit the FlowViz GitHub page and clone the repo to your local machine.
- Install dependencies: Run npm install in the project directory.
- Configure your API key: Add your OpenAI or Anthropic API key to the environment configuration.
- Launch the application: Run
npm run dev:fulland access FlowViz athttp://localhost:5173. - Analyze your first report: Paste a URL from The DFIR Report or another threat intelligence source and watch the attack flow generate in real-time.
For detailed installation instructions and troubleshooting, see the official documentation.




Frequently Asked Questions
What is FlowViz?
FlowViz is an open-source, AI-powered web application that transforms unstructured cyber security threat reports into interactive attack flow visualizations. Created by David Johnson of Feedly, it uses Large Language Models to automatically extract tactics, techniques, and procedures (TTPs) from text and map them to the MITRE ATT&CK framework. The output is a visual, temporal graph showing how an attack progresses from initial access to impact.
Is FlowViz Free?
Yes, FlowViz is free and open-source under the MIT License. However, it operates on a “Bring Your Own Key” (BYOK) model. You need a valid API key from either OpenAI or Anthropic to use the AI extraction features. While the software costs nothing, analyzing reports with models like GPT-4 or Claude 3 can cost between $0.10 and $2.00 per run, depending on the length of the report and the number of tokens used.
What AI Models Does FlowViz Support?
FlowViz supports multiple LLM providers, most notably Anthropic (Claude) and OpenAI (GPT). The tool frequently leverages Claude 3 or Claude 3.5 due to its massive context window (200,000+ tokens), which allows FlowViz to ingest entire lengthy reports in a single pass without losing critical details from the middle of the attack chain. OpenAI’s GPT-4 is also supported for users who prefer that provider.
What Is the Difference Between FlowViz and the MITRE Attack Flow Builder?
The MITRE Attack Flow Builder is the official tool from the Center for Threat-Informed Defense for manually constructing attack flows. It is precise but labor-intensive, requiring users to drag and drop every node and draw every connection. FlowViz is the automation engine that complements it. You use FlowViz to generate an 80% complete rough draft in seconds, export the .afb file, and then import it into the MITRE Builder for final polish and validation. They are complementary tools, not competitors.