
You think your detection rules are protecting you? They might be landmines.
You buried them yourself. There is no map. The one person who remembers where they are quit 18 months ago!
Picus Security’s Blue Report 2026 found that fewer than one in seven simulated attacks produced an alert. If you’re still clicking save on rules in your SIEM console, detection as code is how you start closing that gap.
This guide will teach you what detection as code is, walk you through the four stages of a working pipeline (validate, translate, test, deploy), and show you the shadow mode safety rail that separates “the rule compiles” from “the rule is production-ready.” You’ll also get real commands, a sample CI job, and the four mistakes that sink most migrations.
Let’s get stuck in!
What is Detection as Code?
Detection engineering is the discipline of building, testing, and maintaining the logic that turns raw telemetry into actionable alerts.
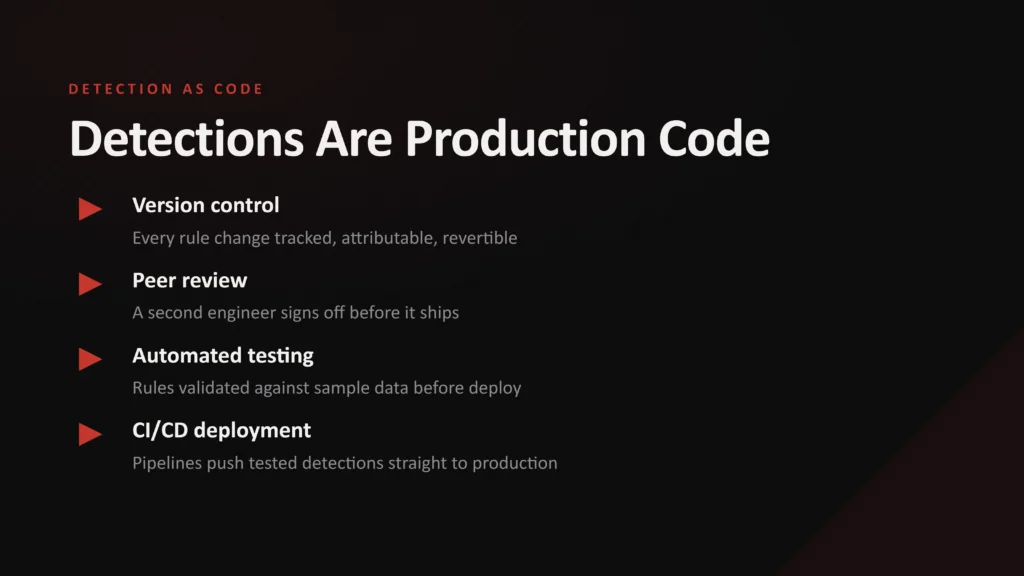
Detection as code applies software engineering practices to that detection engineering lifecycle. Think version control, peer review, automated testing, and Continuous Integration/Continuous Deployment (CI/CD).
In a legacy Security Operations Center (SOC), an analyst writes a query in the Security Information and Event Management (SIEM) console, clicks save, and it’s live.
No review. No test. No rollback path.
If that query is malformed or too broad, you find out when it floods the alert queue at three in the morning. Or worse… when it silently does nothing and a real intrusion walks straight past it.
Microsoft and Omdia’s State of the SOC research found that an estimated 46% of alerts are false positives and 42% go uninvestigated. Your alert fatigue isn’t a productivity problem. It’s an adversary cloaking device.
Switching to detection as code doesn’t automatically fix alert fatigue. It gives you the engineering scaffolding to fix it systematically. Migrate your pipeline but skip the validation gates, and you’re just automating the chaos faster.
So what does this look like in practice?
Key Detection as Code Stages
Before you write a single stage, you need four things in place:
- A Git repository that acts as the single source of truth for your rule logic.
- A vendor-neutral rule format (ideally Sigma) so you’re not married to one query language.
- A CI/CD runner that runs lint, translate, and test on every pull request, then deploys on merge to main.
- A SIEM with an API you can interact with using code. Most modern SIEMs have one.
Stage 1: Validate and Lint
Every rule gets checked before anything else happens. Linting covers three things:
- Syntax: Is the YAML well-formed?
- Schema conformity: Does the rule follow the Sigma specification?
- Metadata completeness: Does it have a severity, an author, an owner, and a MITRE ATT&CK mapping?
Here’s a rule that passes those checks, saved as rules/windows/proc_creation_win_powershell_encoded_cmd.yml:
title: Encoded PowerShell Command Line
id: a7cb7230-0327-4d7a-9046-d249dc4413a3
status: experimental
description: Detects PowerShell launched with an encoded command
author: Kraven Security
owner: soc-detection-team
tags:
    - attack.execution
    - attack.t1059.001
logsource:
    category: process_creation
    product: windows
detection:
    selection:
        Image|endswith:
            - '\powershell.exe'
            - '\pwsh.exe'
        CommandLine|contains:
            - ' -enc '
            - ' -EncodedCommand '
    condition: selection
falsepositives:
    - Legitimate admin scripts
level: medium
Notice the trailing space in ' -enc ‘. Without it, the rule would also match the harmless -Encoding parameter used all over admin scripts. That said, this rule is simplified for illustration. Production rules should also cover the -e and -ec aliases (documented by Microsoft for PowerShell 7) and / prefixed variants; the SigmaHQ repository’s rules are a good reference.
To validate this rule, run sigma check --fail-on-issues rules/ with Sigma CLI, or runreveal lint sigma rules/ if you’re on RunReveal, as the first job in your CI runner.
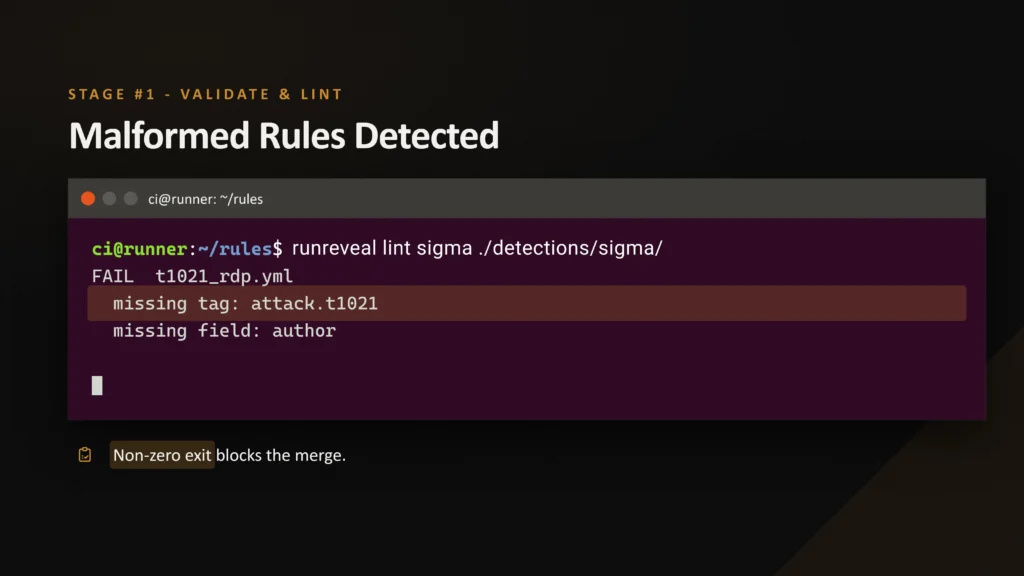
Here’s the key design choice: the linter must return a non-zero exit code when a rule fails. That’s the whole point. By default, sigma check only fails on parsing errors, so the --fail-on-issues flag is what turns validation warnings into a merge blocker. You can’t merge a malformed rule. It stops dead at stage one.
Stage 2: Translate With pySigma
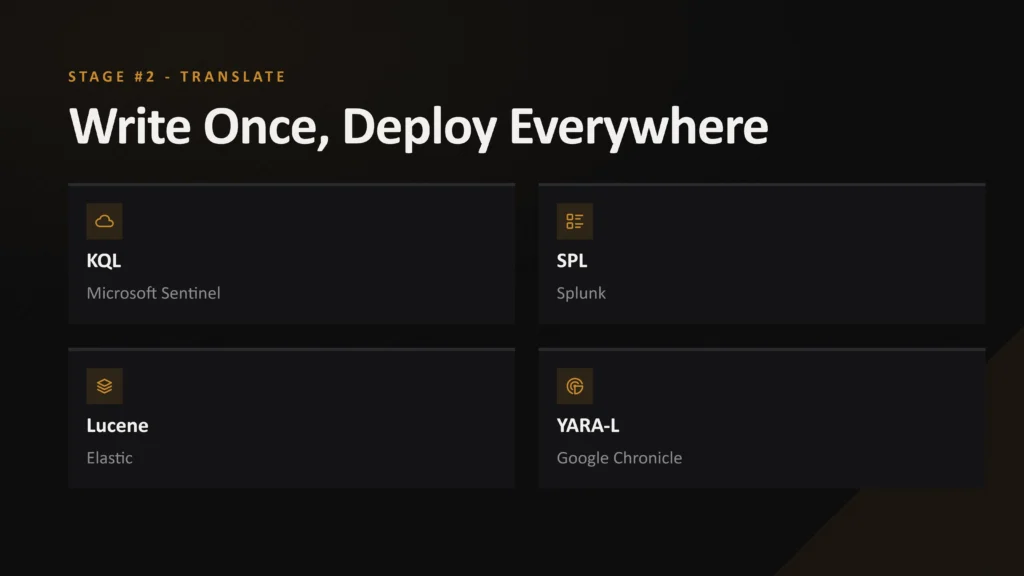
Next up, translation. pySigma backends convert your Sigma rule into the query language of Splunk, Microsoft Sentinel, Elastic, and many other platforms.
This is where detection as code starts paying off. You write a rule once, then deploy it as Kusto Query Language (KQL), Search Processing Language (SPL), Lucene, or another target without rewriting the logic.
But a rule that converts isn’t the same as a rule that matches your logs. Your SIEM probably doesn’t name its fields the way Sigma does. That’s where processing pipelines come in, which you pass to Sigma CLI with the -p (--pipeline) option. Backends and pipelines are separate plugins, so install both:
sigma plugin install splunk
sigma plugin install sysmon
sigma convert -t splunk -p sysmon rules/Pipelines handle two data model translations:
- Field mappings: Rename standard Sigma fields to match your SIEM environment.
- Log source mappings: Target the log sources your site actually collects.
Skip this step, and you’ll get perfectly valid queries that search for fields that don’t exist. They’ll never fire, and nobody will notice.
Want to practice writing and converting rules before automating everything? My walkthrough on arming yourself with custom Sigma rules is a great hands-on starting point.
Stage 3: Automated Testing
This is the stage click ops never had. It’s also the one that matters most.
Your rule gets replayed against two sets of log fixtures:
- Malicious fixtures: Logs that capture the attack behavior the rule should detect. Running Atomic Red Team tests in a lab is a quick way to generate them.
- Clean baseline fixtures: Logs of known good activity. SigmaHQ’s own CI does exactly this, checking its Windows rules against Nextron Systems’ evtx-baseline of clean event logs.
Then two simple checks decide the rule’s fate:
- If the rule doesn’t fire on a malicious fixture, the pipeline fails, and the pull request is blocked.
- If the rule does fire on a known good fixture, the pull request is blocked again.
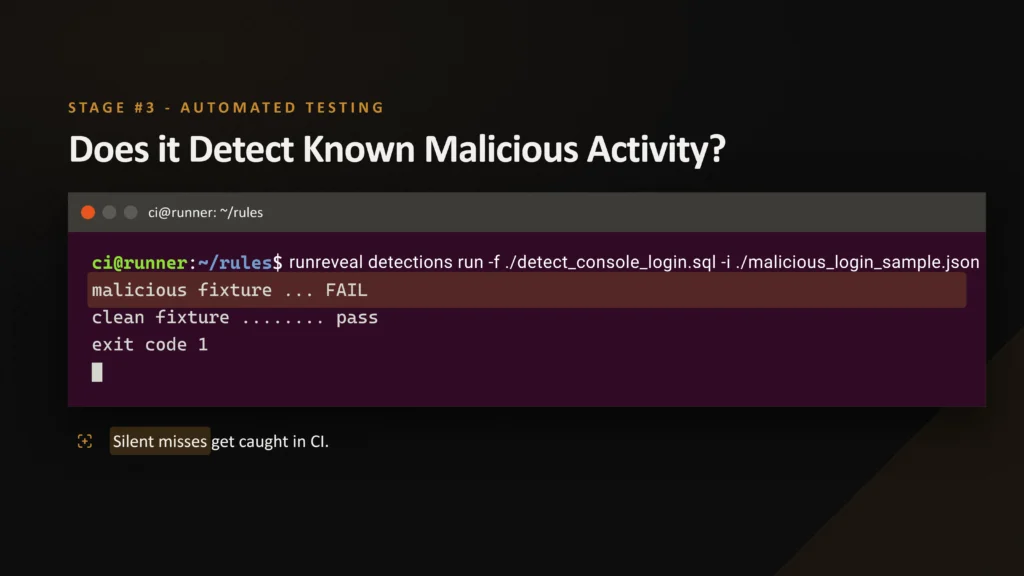
Keep each rule’s fixtures next to its name so your pipeline can pair them automatically:
rules/windows/proc_creation_win_powershell_encoded_cmd.yml
tests/proc_creation_win_powershell_encoded_cmd/malicious.ndjson
tests/proc_creation_win_powershell_encoded_cmd/clean.ndjson

# or malicious.evtx / clean.evtx for evtx-sigma-checkerRunReveal’s CLI gives you the matching engine. Its runreveal detections run command takes a Sigma rule and a local NDJSON file of sample events, then reports which lines match.
Wire it all together, and your pull request job looks something like this:
name: detection-pipeline
on: pull_request
jobs:
  validate-translate-test:
    runs-on: ubuntu-latest
    steps:
      - uses: actions/checkout@v4
      # Pin versions (current as of September 2026) for reproducible builds
      - run: pip install sigma-cli==3.1.0 pysigma-backend-splunk==2.1.0 pysigma-pipeline-sysmon==2.0.0
      - run: sigma check --fail-on-issues rules/
      # Owner check uses mikefarah's yq and covers nested rule folders
      - run: find rules -name '*.yml' | while read -r f; do yq -e '.owner' "$f" > /dev/null || exit 1; done
      - run: sigma convert -t splunk -p sysmon rules/ -o splunk_queries.txt
      - run: ./tests/run_fixtures.sh
      # Upload for reviewers and integration tests
      - uses: actions/upload-artifact@v4
        with:
          name: splunk-queries
path: splunk_queries.txtThe run_fixtures.sh step is your own test harness. It runs each rule against its two fixture files, then fails if the malicious file gets no match or the clean file gets any match. If you use runreveal detections run, have the script parse its per-line match output to make that decision.
For Windows rules, Nextron’s evtx-sigma-checker (from the evtx-baseline releases, and the same tool SigmaHQ’s CI uses) runs Sigma rules directly against EVTX fixtures. Either way, fixture field names must match the rule’s field names.
There’s a catch, though. Those checks test the Sigma rule, not the query your SIEM actually runs. Think of it as two levels:
- Logic tests run the Sigma rule against fixtures and prove the detection idea works.
- Integration tests run the converted query against the same fixtures loaded into a dev index in your real SIEM. This level catches the field-mapping bugs from Stage 2.
No human has to catch a silently broken detection. You find out in the CI pipeline instead of during a real incident.
Stage 4: Deploy
Deployment runs in a separate job triggered on: push to main, so nothing reaches production until a reviewer approves the merge. It re-runs the conversion on the merged code and pushes the result through your SIEM’s API, keeping Git as the single source of truth.
CERT-EU’s droid, a pySigma wrapper, is built for this: it deploys a repository of Sigma rules to one or more SIEM or Endpoint Detection and Response (EDR) platforms.
But here’s the safety rail almost nobody talks about… shadow mode.
No sandbox reproduces the real noise of your live network. So your pipeline deploys each rule in a non-alerting state first. The rule still runs. It just doesn’t wake anyone up.
| Platform | Shadow mode approach |
|---|---|
| Microsoft Sentinel | Rule enabled, incident creation off |
| Splunk | Scheduled search with no alert action |
| Elastic | Deployed as a building block rule |
- In Sentinel, set
createIncident: falsein the rule’s incident configuration so alerts land in the SecurityAlert table without creating incidents, and check that no alert-triggered automation rules apply to it. If you’ve moved Sentinel into the Defender portal, also check that the rule is excluded from Defender XDR correlation so shadow alerts aren’t pulled into incidents. - In Splunk, review results under Activity > Jobs and raise the search’s
dispatch.ttl, because scheduled job results expire after twice the schedule interval by default. - In Elastic, building block rule alerts are hidden from the Alerts page by default.
I use roughly seven days as a starting point, watching how the rule behaves against real telemetry before it can alert. That is the difference between “the rule compiles” and “the rule is production ready.”
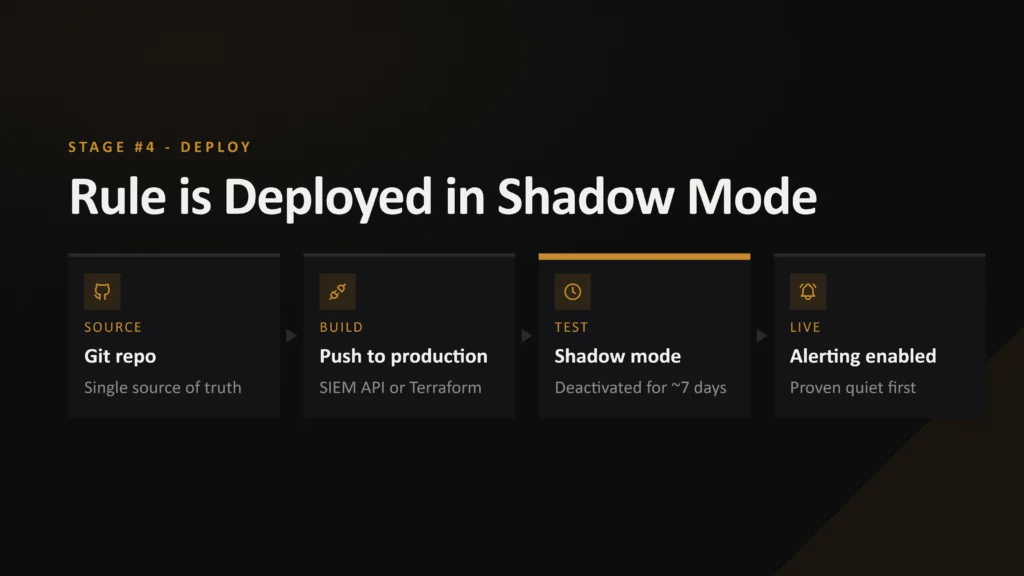
That seven-day window is predictable. An attacker who fingerprints a fixed shadow period roughly knows how long a fresh Tactic, Technique, or Procedure (TTP) survives before coverage catches up.
The discipline that makes you auditable also makes you predictable.
So, how does a blue team counter this? Two ways:
- Review shadow telemetry daily, not just at the end of the window.
- Hunt in parallel. Hunt for the exact gap a new rule is designed to close while it sits in shadow mode. See my guide on pairing threat intelligence with threat hunting and use Velociraptor for targeted endpoint hunts.
The pipeline buys you auditability. It doesn’t buy you the right to stop paying attention.
The Case for Detection as Code
No pipeline is perfect. At scale, delayed and out-of-order logs will test it. So why bother? Because the payoff is hard to ignore.
- Full Audit Trail
Git history shows who changed what, when, and why. - Peer Review on Every Change
No rule ships without a second set of eyes. - Instant Rollback
A bad rule becomes a git revert, not a panicked reconstruction from memory - Portable Detection Logic
Sigma rules aren’t welded to one vendor’s query syntax. - Automated Regression Testing
Every change is tested against malicious and clean data. - Machine-Readable Metadata
AI triage agents can actually consume structured severity, ownership, and ATT&CK data.
Now for the part most teams underestimate: the cost.
Many SOC teams were hired as analysts, not engineers. Git, CI/CD debugging, and YAML schemas are a real skills gap. Pretending it isn’t sets your team up to fail!
Pipelines also need maintenance, and shadow mode adds roughly a week to every deployment. Brutal during an active campaign. That tension between speed and rigor is the whole detection game. Make your trade-offs deliberately, and track the right CTI program metrics to see if they’re paying off.
I recommend a documented “emergency lane” for active campaigns: full lint, translation, and testing, but a shortened shadow period watched by a named reviewer.
Common Detection as Code Mistakes
Going down the detection-as-code route? Avoid these four mistakes.
Mistake 1: Windowing on event time instead of ingestion time
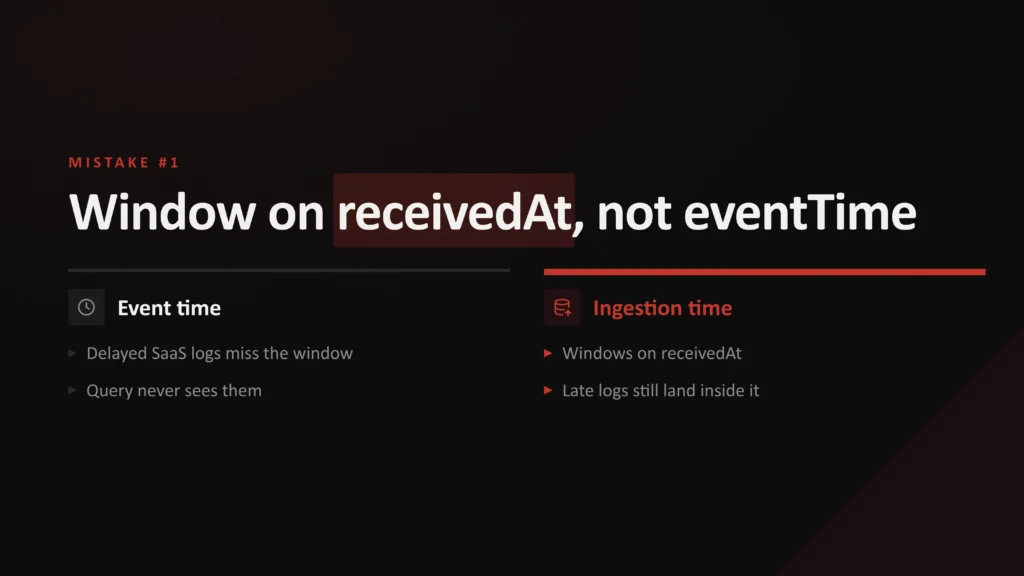
Delayed logs from Software as a Service (SaaS) platforms can land after your lookback window closes, so an event-time query never sees them. RunReveal’s documentation recommends windowing on receivedAt rather than eventTime because many log sources deliver data late. One caveat: ingestion-time windows can re-fire on backfilled or replayed logs, so pair them with alert deduplication.
Mistake 2: Skipping shadow mode to move faster
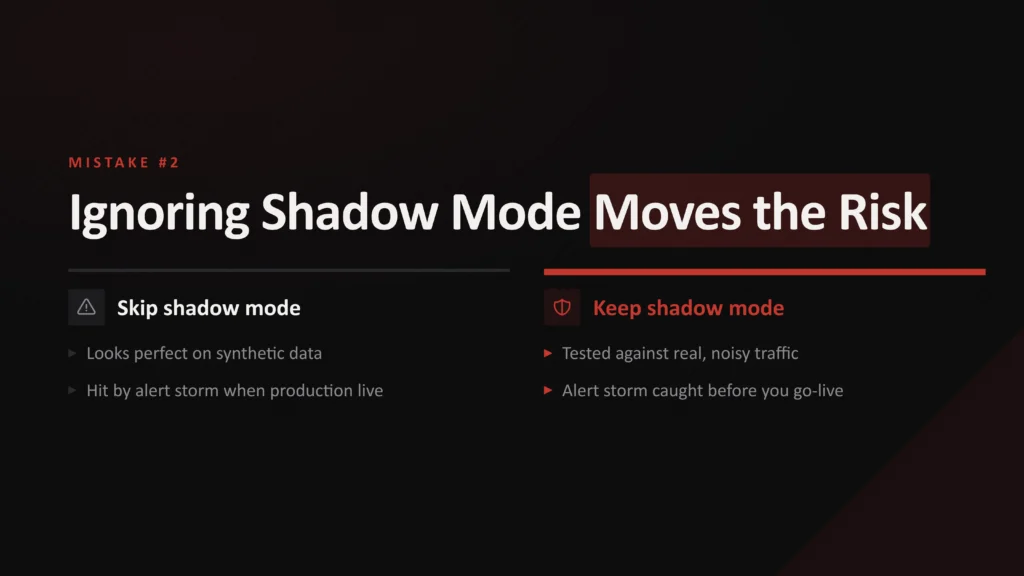
This is how a rule that looked perfect against synthetic data floods your queue the moment it meets real traffic. You didn’t remove the alert storm risk. You gave it a bigger blast radius.
Mistake 3: Rule parity failure in multi-environment deployments
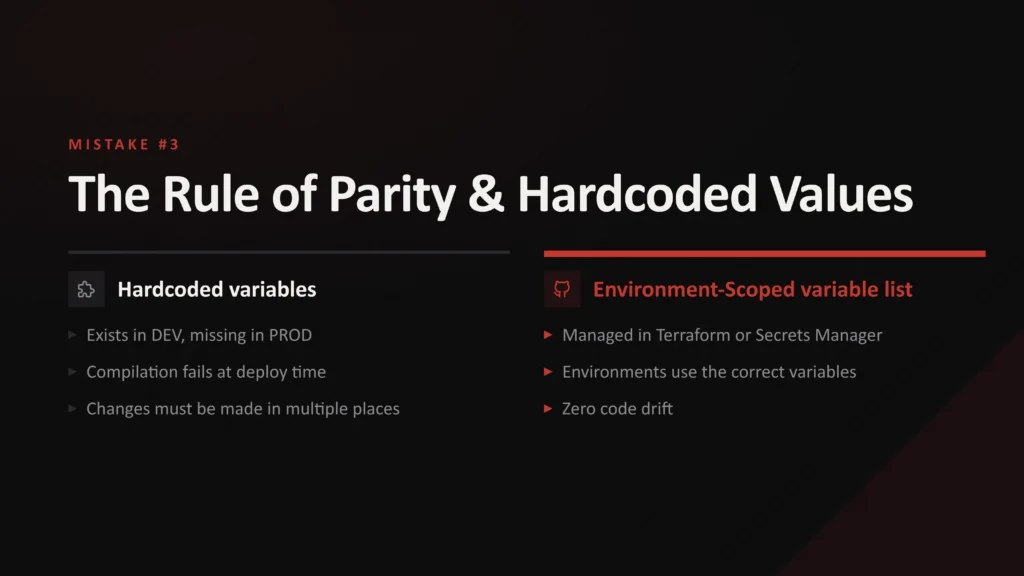
If a rule depends on an allowlist variable that exists in dev but not prod, deployment or query execution fails at the worst moment. Fix it with environment-scoped reference lists managed in tools like Terraform or a secrets manager, not hard-coded values.
Mistake 4: Shipping custom rules with no ownership data
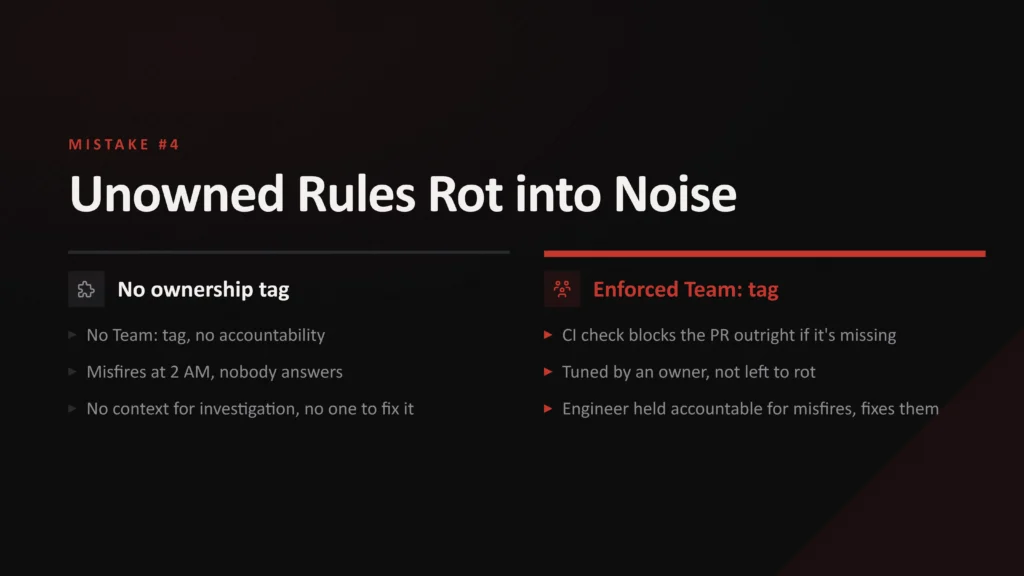
No team tag. No accountability. When a rule misfires at two in the morning, nobody knows who owns it. If nobody owns a rule, nobody tunes it, and it rots into noise or a blind spot. Make owner a required field. Sigma CLI won’t enforce custom fields, so add a one-line CI check like the yq -e ‘.owner’ step shown earlier.
Minimum metadata every rule should carry
Title and description: What it detects and why.
Author and owner: Who wrote it and who tunes it.
Severity: How urgently to respond.
MITRE ATT&CK mapping: The techniques covered.
Log source: The telemetry it needs.
Known false positives: Legitimate activity that may trigger it.
Notice a pattern? Every mistake shares one root cause: treating the pipeline as a deployment mechanism instead of a coding discipline.
Most failed migrations don’t fail on tooling. You can buy the tools. You can’t buy a code review culture.
Conclusion
This guide has taught you what detection as code is, the four-stage pipeline (validate, translate, test, deploy), the shadow mode safety rail, and the four mistakes that sink good migrations.
But here’s the problem detection as code can’t solve on its own… a perfectly engineered pipeline still only catches what you told it to look for. Every rule in your repository depends on a decision about which threats matter.
- Which assets matter most?
- Which adversaries target your sector?
- Which attack paths deserve coverage first?
Answering those questions is threat modeling, supported by crown jewel analysis and threat profiling. It has to happen upstream of everything in this guide, or you’ll optimize the wrong pipeline perfectly.
Start small. Pick five of your noisiest rules, move them into Git, and put them through the pipeline. Good luck!




Frequently Asked Questions
What is Detection as Code?
Detection as code is the practice of managing detection rules like software: version control, peer review, automated testing, and deployment to your SIEM through a CI/CD pipeline.
What Does a Detection as Code Pipeline Look Like?
A typical detection engineering pipeline has four stages: lint rules with Sigma CLI, convert them with pySigma, test them against malicious and clean log fixtures, then deploy through your SIEM’s API. The first three stages block the pull request if a rule fails; deployment only runs after merge.
What is Shadow Mode in Detection Engineering?
Shadow mode is deploying a new rule in a non-alerting state so you can watch it run against real telemetry, then promoting it after roughly a week of clean behavior.
Does Detection as Code Reduce False Positives?
Not automatically. Fixture testing, peer review, and shadow mode reduce them; without those gates, you just deploy noisy rules faster.
How Does Detection as Code Relate to Threat Intelligence?
Threat intelligence decides what to detect. Detection as code decides how it ships. Aligning your rules with priority intelligence requirements keeps your pipeline focused on the threats that matter most.